Monitoring
The operator exports one set of Prometheus metrics per Migration. The Helm chart ships the parts that consume them, all opt-in: a ServiceMonitor for the scrape, alert rules as a PrometheusRule, and three Grafana dashboards. This page is the reference for the metrics and for wiring the chart into a kube-prometheus-stack setup.
Scrape setup
The manager serves metrics over HTTPS on :8443 and authenticates every scrape.
metrics.enabled (default true) controls the endpoint and its Service.
With the Prometheus Operator, metrics.serviceMonitor.enabled=true is the whole scrape setup, and the ServiceMonitor sends Prometheus' own ServiceAccount token.
The ServiceAccount that scrapes also needs get on the /metrics nonResourceURL.
kube-prometheus-stack already grants that to its Prometheus, and the 401, 403, and 500 sections in Troubleshooting map the failure modes.
The ServiceMonitor sets honorLabels: true.
The namespace and name labels on migration metrics therefore stay the Migration's own, and the scrape does not rename them to exported_namespace.
The chart scrapes every 10 seconds, the same as the nominal poll interval of an active worker.
Gauges change when the controller sees the worker, so a slower scrape can miss samples between two changes.
Raise metrics.serviceMonitor.interval if that is more traffic than you want, and expect the dashboards to lag by what you set.
metrics.serviceMonitor.additionalLabels labels the monitor for a Prometheus that selects by label; scrapeTimeout, relabelings, and metricRelabelings tune the rest.
Controller timing
The normal path for an active worker asks for its next poll 10 seconds from the start of the reconcile pass. The chart's 10-second scrape matches that interval, but slow operations, controller queue delays, and other phase or retry paths can push a sample later.
Metric reference
Every pgcopydb_migration_* metric is a gauge labeled namespace and name for the Migration it describes.
A value the operator does not know is absent, never zero: dashboards and alerts MUST treat a missing series as "no data", not as 0.
| Metric | Extra labels | Meaning | Exists |
|---|---|---|---|
pgcopydb_migration_phase |
phase |
1 for the current phase | always |
pgcopydb_migration_attempts |
Worker Jobs created so far | always | |
pgcopydb_migration_info |
mode |
Always 1; mode is clone or follow |
always |
pgcopydb_migration_start_time_seconds |
Unix time the first attempt started | once started | |
pgcopydb_migration_completion_time_seconds |
Unix time the migration completed | once completed | |
pgcopydb_migration_condition_transition_timestamp_seconds |
type, status |
Unix time of that condition's lastTransitionTime |
per condition |
pgcopydb_migration_verified |
1 when every requested compare check passed, 0 if any mismatched | after a verification result | |
pgcopydb_migration_verification_check |
check: schema or data |
1 when that check passed, 0 on mismatch, -1 when spec.verification does not request it |
once the spec is read, except a requested check with no result yet |
pgcopydb_migration_source_database_size_bytes |
Source database size; summed over the instance with allDatabases |
worker running | |
pgcopydb_migration_target_database_size_bytes |
Target database size; summed over the instance with allDatabases |
worker running | |
pgcopydb_migration_tables_done / _tables_total |
Tables copied and tables planned | worker running | |
pgcopydb_migration_indexes_done / _indexes_total |
Indexes built and indexes planned | worker running | |
pgcopydb_migration_clone_copied_bytes / _clone_planned_bytes |
Base-copy bytes moved and bytes planned | worker running | |
pgcopydb_migration_replication_lag_bytes |
Total replication lag | follow, streaming | |
pgcopydb_migration_source_lsn_bytes |
Source write-ahead log (WAL) head as an absolute byte position | follow, streaming | |
pgcopydb_migration_write_lsn_bytes |
The walsender's write_lsn on the source, or the slot's confirmed_flush_lsn where the stat columns are masked |
follow, streaming | |
pgcopydb_migration_replay_lsn_bytes |
Source-visible replay feedback, including certified idle progress, as an absolute WAL byte position | follow, streaming | |
pgcopydb_migration_endpos_lsn_bytes |
Cutover endpos as an absolute byte position | after cutover set it | |
pgcopydb_operator_build_info |
version |
Always 1; operator-wide, no migration labels | always |
The "Exists" column is the contract for when a series is present:
- always: from the first reconcile of the Migration until its deletion removes every series.
- worker running: the sizes are live samples from the worker pod, so they appear during an attempt and end with the pod.
- worker running for single-database counters too, but they have two sources and the second is more exact.
While the copy runs, the psql sample that reads the sizes also counts relations on both databases.
It weighs tables that hold rows on the target, and their table bytes, against the tables the target was given and their size on the source.
It weighs indexes the target has built against the indexes the source has.
A table with no rows on the source has nothing to copy and counts as done.
A table with rows on the source and none on the target does not, whatever storage its restored schema holds.
Neither does a table that one of pgcopydb's copy workers holds under an exclusive lock, or, on a PostgreSQL 14 or later target, any table the worker is still copying into.
The sample never reads such a table, because its rows stay invisible until that copy commits.
Any other pgcopydb lock is short, such as an index worker attaching a constraint to a copied table, and the sample waits for it.
The sample needs psql and GNU
timeoutin the runner. pgcopydb's own accounting then replaces it where it can be read: at clone completion for a plain clone, and from the verify Job's log after cutover for a follow migration. Both need an allowlisted runner version (see Troubleshooting). - follow, streaming: a plain clone never produces these lag and log sequence number (LSN) gauges.
In follow mode they appear as soon as the replication slot answers, which is during the base copy and before the
Streamingphase. - per condition: one series per condition in
status.conditions, labeled with the status it changed into. A flip retires the old{type,status}pair and stamps a new one, so the endpoint never carries more than one series per condition type. The retired pair keeps its samples in Prometheus, so query the timeline aslast_over_time(...[$__range])rather than at the range end. That puts both sides of a flip on the panel, and it is the only way to read a Migration that was deleted.
Read the timeline off the condition transitions, not off the phase. Read completion off the table and index counters: the clone-byte ratio stops a few percent short of 100, for the reason in the caveats below.
With spec.clone.allDatabases: true, each size gauge sums pg_database_size(oid) over its endpoint's databases and skips only template0 and template1.
The target sum includes databases that already existed, not only the ones this Migration created.
Table, index, and clone-byte counters are absent in this mode.
The operator reads neither per-database relation counts nor the instance catalog's empty counters.
[!note] Size gauges measure physical storage, not bytes transferred by this Migration. Growth on unrelated target databases contributes to the all-databases target gauge, and maintenance or recovery can shrink either gauge. A slope estimates storage growth, not isolated copy throughput;
rate()assumes a monotonic counter and is not appropriate for these gauges.
Each progress query runs under a timeout that connection-string options cannot disable.
A sample therefore leaves no session timeout behind for a later COPY or index build to inherit.
When one side fails, its gauges keep their last value while the other side updates.
The operator logs progress sample lost a side with the reason when a side stops answering, and logs again when it answers.
The reason is the server's error or the failed connection's host and port.
Any other psql message is withheld, because libpq echoes a connection URI it cannot parse, password included.
A failed sample never completes or fails a migration.
status.progress.observedAt is when a sample last wrote the relation counts into status.
A sample that loses either side writes nothing, so the timestamp stops with the counts and its age is how long they have stood still.
Read it next to the log: an observedAt minutes old after a progress sample lost a side line, with no progress sample side answers again since, means status is showing old figures, and the worker log tells whether the copy itself still moves.
It is absent before the first counted sample and in all-databases mode, and pgcopydb's own count drops it when it replaces the estimate.
pgcopydb_migration_phase is an instantaneous gauge; after the first Pending bootstrap, the phase summarizes the conditions.
A phase shorter than the scrape interval is never sampled.
A transition timestamp survives that, because the value stands for as long as the condition holds.
A condition that changes twice inside one scrape interval publishes only the later transition, because the Migration keeps one lastTransitionTime per condition.
Four quantities stay in PromQL and get no metric of their own:
- Receive lag is
source - write. - Apply backlog is
write - replay. - WAL generation is
rate(source_lsn_bytes). - Percent done divides the done gauges by their totals.
Receive lag reads high by one confirmation wherever write fell back to the slot's confirmed flush position.
A pass whose source row carried no confirmed position keeps the earlier replay and lag values, so both read stale for one pass rather than wrong.
Apply backlog reads both operands from the same walsender row, so the order that holds there holds here.
Without pg_read_all_stats both fall back to the slot's confirmed flush position and the difference reads zero, which means unknown rather than caught up.
The bundled runner, pgcopydb 0.18.15.gea2dc96, confirms target commits with synchronous_commit=on before reporting their replay progress.
It can also certify genuine primary keepalive positions from the current connection, advancing network feedback across filtered WAL.
That feedback does not move the target replication origin or the sentinel's data replay cursor; see Follow diagnostics for the conditions.
An advancing replay gauge on an idle publication therefore does not imply new target rows or measure applied-data throughput.
Other supported runner versions differ; see client tool versions.
Receive batching does not make these LSN slopes end-to-end throughput measurements or remove the drain-verification gate.
Dashboards
The chart ships three dashboards, linked to each other through their shared pgcopydb tag:
- Migration Detail (uid
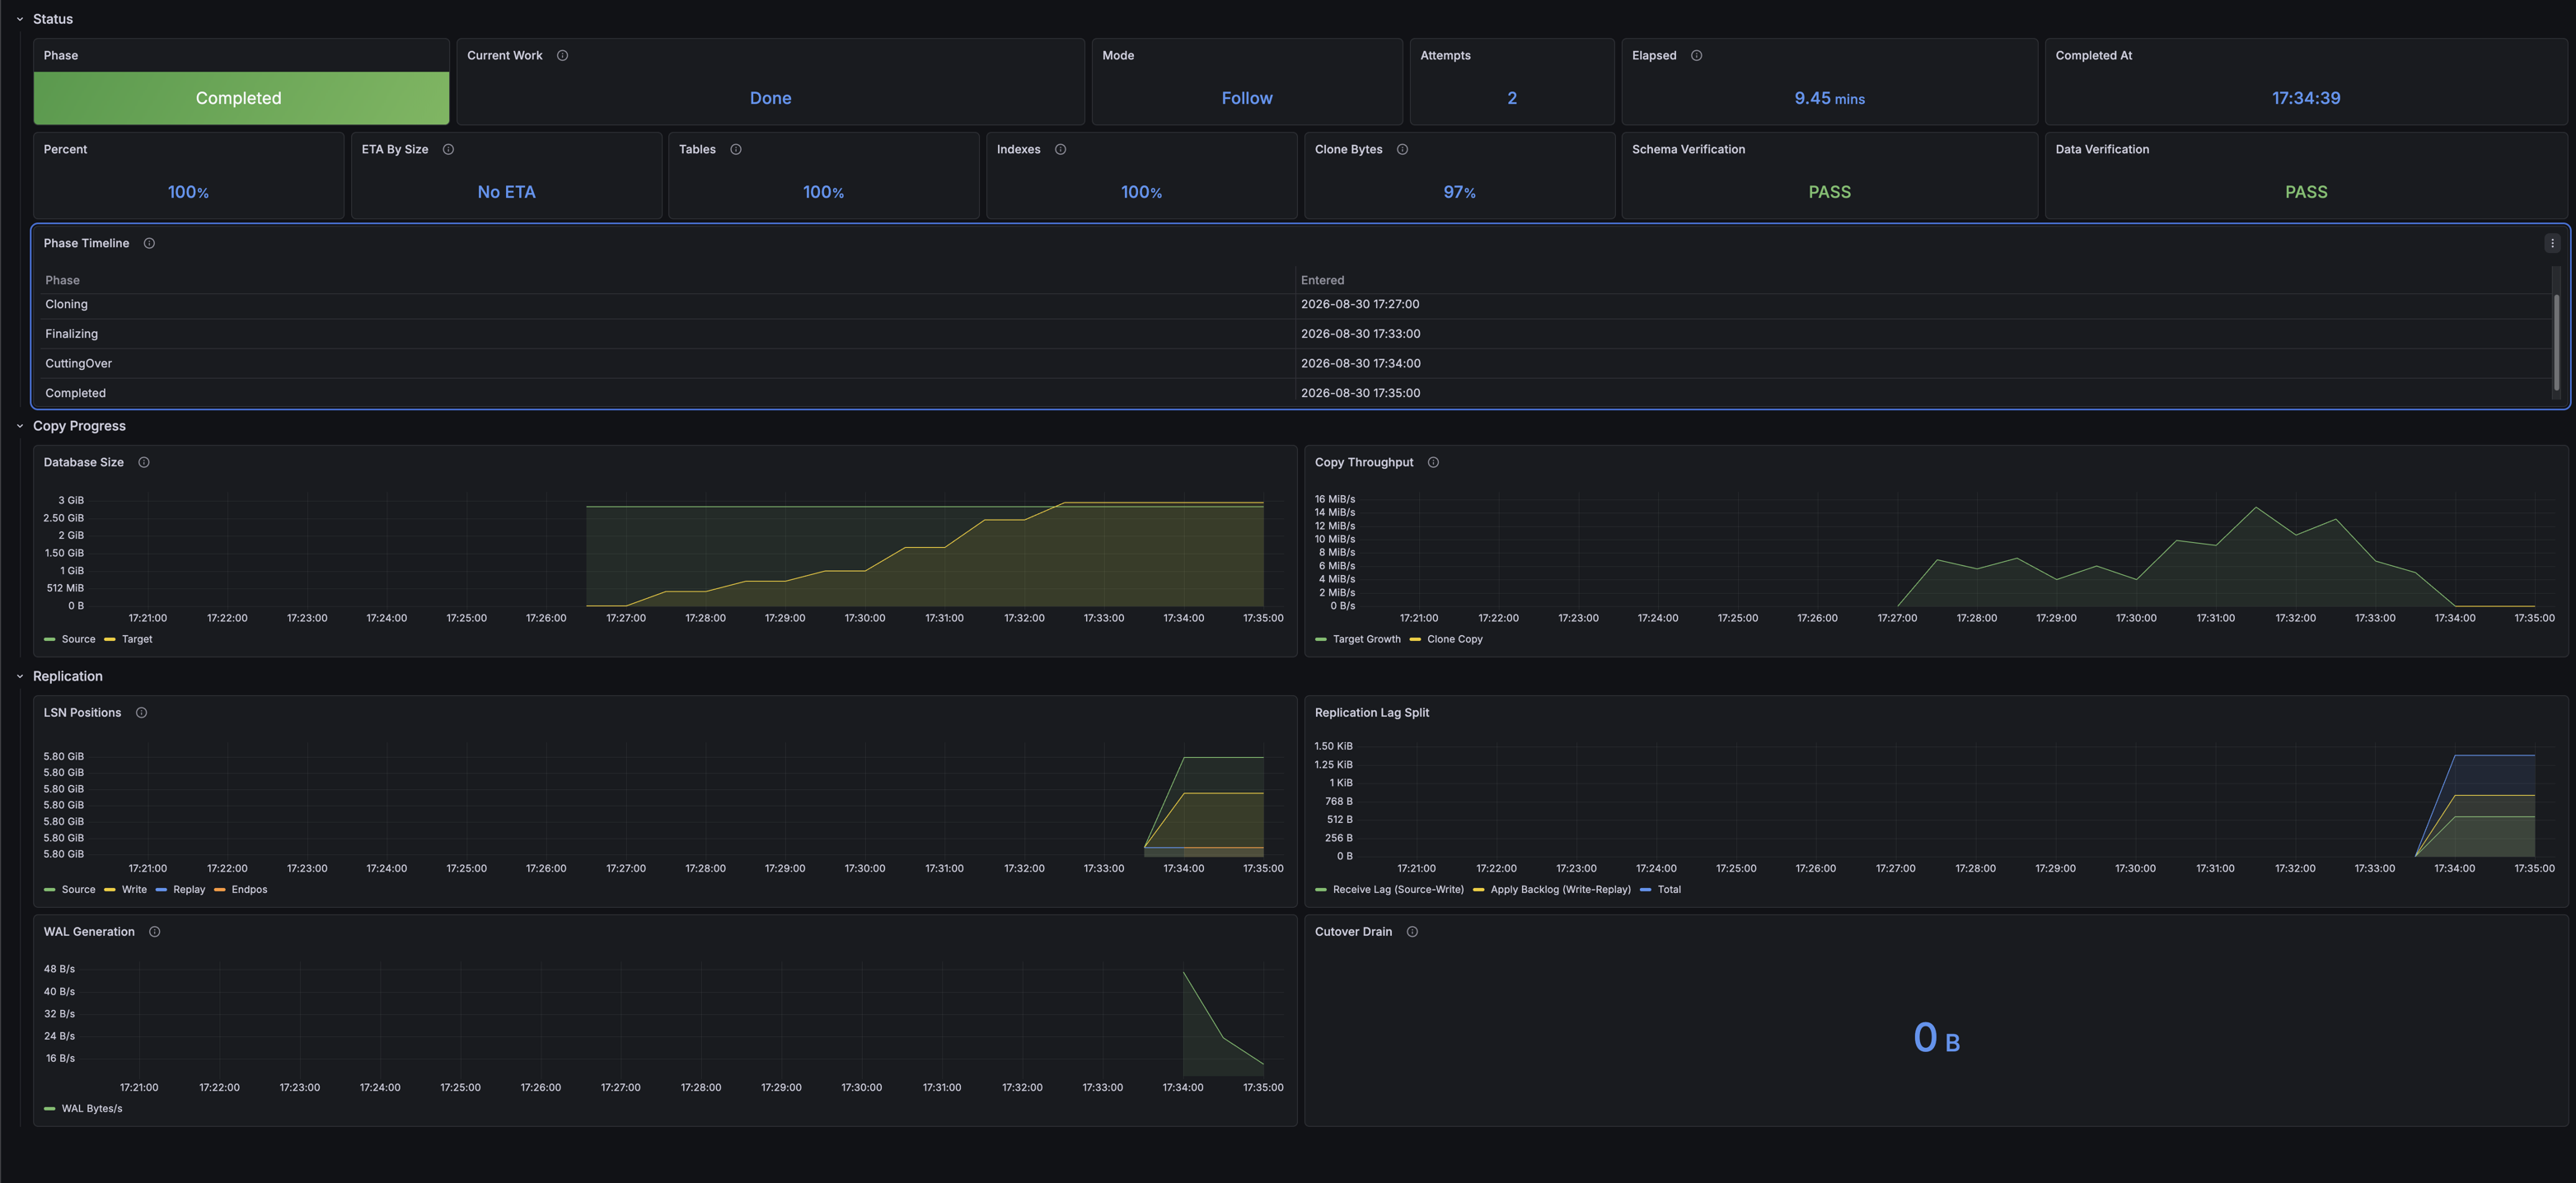
pgcopydb-migration): one migration end to end. Two rows of stat tiles come first: state and timing, then progress and the compare check results. Below them are two timeline tables side by side, phases as sampled and condition transitions as stamped. The rest charts database sizes and copy throughput, LSN positions with the lag split, WAL generation, and the cutover drain. - Fleet Overview (uid
pgcopydb-fleet): counts by phase, an all-migrations table whose name column links into the detail dashboard, and lag, throughput, and attempt churn per migration. - Operator Health (uid
pgcopydb-operator): build and leader status, reconcile rate and duration percentiles, workqueue depth and latencies, and process CPU, memory, goroutines, and file descriptors.
All three refresh every 10 seconds, the same as the nominal poll and scrape intervals. A slow controller pass, a queued reconcile, or a late scrape can delay what reaches the screen. Grafana's refresh picker overrides the saved value for your session.
Wiring the chart into Grafana
Two things have to exist first, and the chart provides neither. You need a Prometheus that scrapes the operator (Scrape setup above), and a Grafana with that Prometheus as a data source. With both in place, set two values:
metrics:
  serviceMonitor:
    enabled: true
grafana:
  dashboards:
    enabled: true
    # The namespace Grafana runs in, not the one the operator runs in.
    namespace: monitoring
    folder: pgcopydb
grafana.dashboards.enabled=true renders each dashboard as its own ConfigMap, labeled grafana_dashboard: "1".
Grafana's sidecar for dashboards watches that label and writes each ConfigMap's data key out as a file, and Grafana loads the file.
kube-prometheus-stack runs such a sidecar by default.
Check that the ConfigMaps landed in the namespace the sidecar watches:
kubectl get configmap -n monitoring -l grafana_dashboard=1
Two sidecar settings then decide whether the dashboards show up, and where:
- Namespace: the sidecar watches only its own namespace unless
sidecar.dashboards.searchNamespacewidens it, sografana.dashboards.namespacehas to name the namespace Grafana runs in. The chart's release namespace is the default and is rarely correct. - Folder:
grafana.dashboards.folderwrites agrafana_folderannotation. The sidecar acts on it only when its ownfolderAnnotationsetting names that annotation and its dashboard provider hasfoldersFromFilesStructureenabled. Otherwise all three land in General, which is cosmetic.
[!warning] The sidecar names the file it writes after the ConfigMap's data key, not after the ConfigMap. A second ConfigMap in that namespace carrying a
migration-detail.jsonkey therefore overwrites this one, last writer wins, with no error logged anywhere; a hand-imported copy kept around for editing is the usual source of that. These are provisioned files rather than Grafana's own dashboards, so Grafana also refuses UI edits over them unless the provider setsallowUiUpdates: true, and the next provisioning pass overwrites whatever it did accept: keep changes in the JSON, or "Save as" a copy under its own uid.
Importing without the sidecar
Import the JSON by hand in Grafana (Dashboards, New, Import).
Render the copies that match the chart you deployed, not the ones on main:
helm template pgcopydb-operator oci://ghcr.io/ydixken/pgcopydb-operator/charts/pgcopydb-operator \
  --set grafana.dashboards.enabled=true \
  --show-only templates/grafana-dashboards.yaml
Each ConfigMap in that output holds one dashboard under a <name>.json data key.
No panel hardcodes a data source, so pick your Prometheus in the dashboard's datasource variable after the import.
Reading Migration Detail
Two variables at the top select the migration: namespace, then name.
Both are filled from pgcopydb_migration_info, so a Migration is listed from its first reconcile until it is deleted.
The tiles read as follows:
- Phase is the state the operator is in.
Current Work is the activity inside that state:
Validatingreads as Preflight Checks,Finalizingas Vacuum And Index Builds, andStreamingas Following WAL. Vacuum And Index Builds appears only after the operator has seen the copy workers start and then stop. - Elapsed is how long the run has taken, and it stops when the run completes. Completed At reads Still Running until the run ends.
- Percent is target size over source size, clamped at 100.
It is the coarsest progress reading, because it covers whole databases with their WAL and catalog overhead.
The counters beside it weigh only the tables in scope.
ETA By Size divides the bytes left by the current growth rate of the target.
It reads No ETA outside
Cloning, because index builds, the cutover drain, and verification do not move bytes at a steady rate. - Tables, Indexes, and Bytes are six tiles, one per side: a
(Source)total beside the(Target)figure measured against it. They read N/A before the target has a schema to count, and for a migration whose worker never ran. Bytes compares table bytes on disk on both sides, so pgcopydb's own wire tally never replaces it. A wire count under an on-disk total would read as a shortfall that is not there. The one exception is a table a copy worker holds under an exclusive lock, such as one pgcopydb copies whole. Until that copy commits, the target counts the bytes the copy has streamed into it, which a target before PostgreSQL 14 cannot report and counts as zero. - Schema Verification and Data Verification are one tile per compare check.
Each reads Pending until its Job produces a result, then PASS or FAIL.
A check that
spec.verificationdoes not request reads Deactivated, which is the default for both. A result outranks the spec, so a check you switch off after it reported a mismatch still reads FAIL. - Cutover Drain is the bytes still to replay before the endpos is reached.
It reads No Endpos until a cutover sets one, and 0 B once source-visible replay feedback reaches it, which is what the screenshot shows.
Only
CutoverCompleted, after target-origin or content verification, proves the drain.
Every tile is scoped to one Migration, so an empty result reads N/A. Some tiles report a fact about the run rather than its current state: Attempts, Elapsed, Completed At, the two verification tiles, and Cutover Drain. These read over the whole range, so a deleted Migration keeps what it last reported instead of N/A. They read the range end first, so a live Migration wins: a wide range can also hold an earlier run that reused the name.
Alerts
metrics.prometheusRule.enabled=true installs the alert rules from charts/pgcopydb-operator/rules/migrations.yaml as a PrometheusRule.
If your Prometheus selects rules by label, as kube-prometheus-stack does, add the matching label with metrics.prometheusRule.additionalLabels.
Thresholds and windows are defaults; the promtool unit tests under test/alerts/ pin each one, so retune there first.
| Alert | Severity | Fires when |
|---|---|---|
PgcopydbMigrationFailed |
critical | The phase is Failed for 5m |
PgcopydbMigrationVerificationFailed |
critical | A compare mismatch stands for 5m |
PgcopydbMigrationRetrying |
warning | Three or more new attempts in 30m while active |
PgcopydbMigrationCloneStalled |
warning | Cloning while the target size is flat for 1h |
PgcopydbMigrationReplicationLagHigh |
warning | Lag above 64Mi for 10m while Streaming or CutoverPending |
PgcopydbMigrationCutoverStalled |
critical | An endpos is set and not reached for 15m |
PgcopydbMigrationCloneStalled matches Cloning alone, because the index and vacuum tail reads as Finalizing and leaves the target size flat while nothing is stalled.
PgcopydbMigrationReplicationLagHigh skips the base copy, where the lag gauge already exists, a large lag is normal, and nothing can act on it.
No alert covers slot retention.
While a follow migration is suspended, failed, or streaming, its replication slot keeps WAL on the source, and the operator's metrics cannot see the source's disk.
Monitor pg_replication_slots on the source itself: active and safe_wal_size, which postgres_exporter exposes.
Alert on inactive slots or on a safe_wal_size that falls.
How this is tested
Static checks and promtool unit tests gate every panel query and alert rule, and each release candidate replays them against a live migration.
Caveats
- The gauges are process state in the manager, so an operator restart clears them and the next reconcile of each Migration restores them. A scrape gap around a restart is normal.
- A finished migration has no worker pod, so the two size series do not come back after an operator restart, though its other series do.
rate()anddelta()over the size gauges misread a database that shrinks as a counter reset. The throughput panels note that, and the stalled-clone alert usesdelta().- The tables, indexes, and clone-byte series step once when pgcopydb's own count replaces the psql estimate. The estimate counts a table once it holds a committed row and, on a PostgreSQL 14 or later target, no copy into it is open. A table copied in parts can therefore count between two of its parts, and during them on an older target. It tests presence rather than a row count because a live source runs ahead of the copy's snapshot until the stream catches up, and a count compared against it never settles. The estimate therefore runs a little ahead, and the step is that correction. Nothing rounds the estimate up when the worker exits 0. A table that is empty on the source counts as done on its own. A finished copy that still reads one table short is therefore a finding: that table holds rows on the source and none on the target (#277). The byte figures are not rounded up either, because fillfactor, bloat, and alignment leave the two sides a little apart. Read a shortfall there against the table count beside it. A failed copy keeps its partial figures.
- The
by sizepercent-done series can read above 100 duringFinalizing. Index builds and pre-vacuum bloat put the target ahead of the source in bytes until vacuum reclaims the space. The query clamps the series at 100. - The planned clone bytes come from pgcopydb's table-size statistics. The ratio of copied to planned bytes stays a few percent short of 100. A relation's on-disk size carries page and tuple headers, alignment padding, and free space that a COPY stream does not move.
- Copy Throughput clamps target growth at 0.
Vacuum reclaims space during
Finalizing, and the negative slope that follows is real but useless as a byte rate. Clone copy needs no clamp. A retry resumes from the same work-dir catalog, and a killedCOPYcredits no partial bytes, so the tally never runs backward. - A custom stock 0.18 runner with psql and GNU
timeoutstill feeds these series, because the sample needs no pgcopydb command. That runner gives up the exact count that replaces the estimate at the end. Finalizingneeds the phase probe to have seen this attempt's copy workers at least once. The probe runs on every poll, about every 10 seconds, so only a copy that ends almost at once keepsCloningthrough its tail. The stalled-clone alert still needs an hour of flat target size, which a copy that short does not produce.